Feature Spotlight: Score Screen (AW)
Early on in Ant War’s development, the only way players could measure who was better than who, is by noting who won and who lost.
We needed more, so I made more!
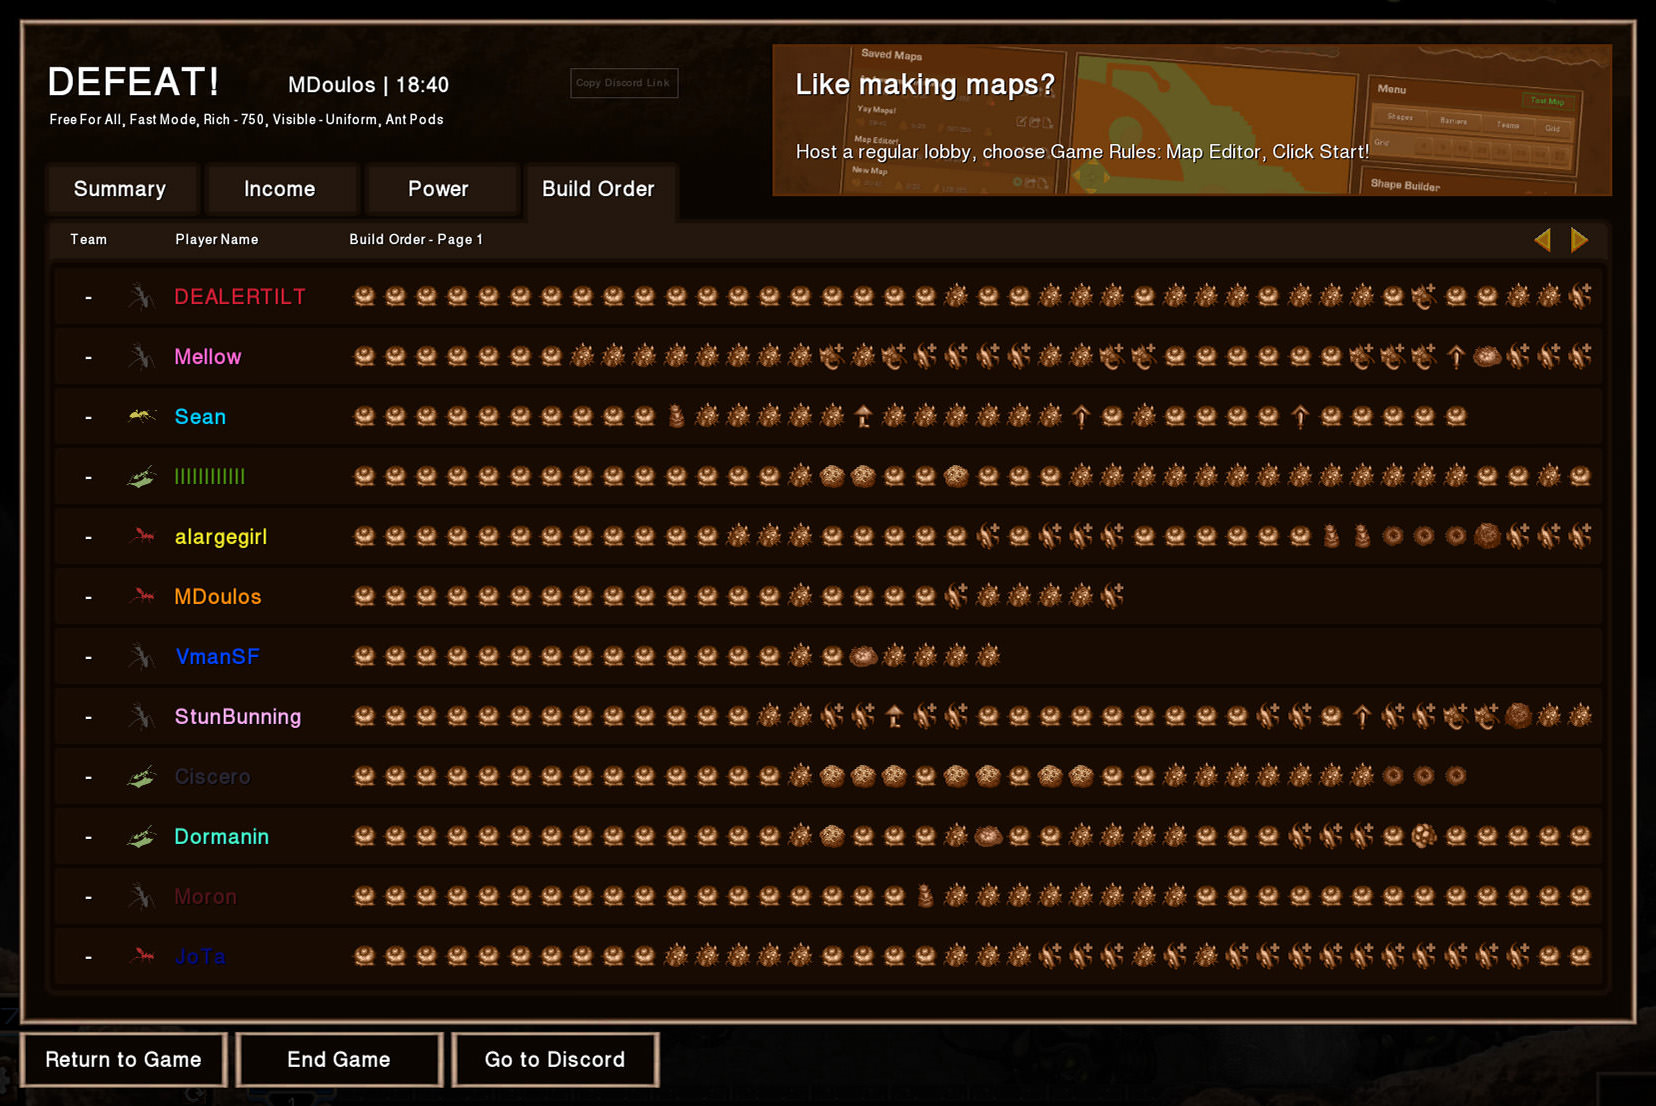
The score screen I made is split into 4 parts: Summary, Income, Power, and Build Order. Let’s talk about each.
First, let’s note that the team number, player race, and player name columns are in all 4 tabs.
Team Number – The team number will be blank if the game mode’s team setup is Free For All or Open Alliances rather than 2v2, 3v3, etc.
Player Race – The player race reflects which of the 4 ant races the player chose to play as: Black, Wood, Fire, or Crazy. The cream colored winged ant appears if the player did not choose and ended the game as a New Queen unit.
Player Name – The username of the player.
Summary
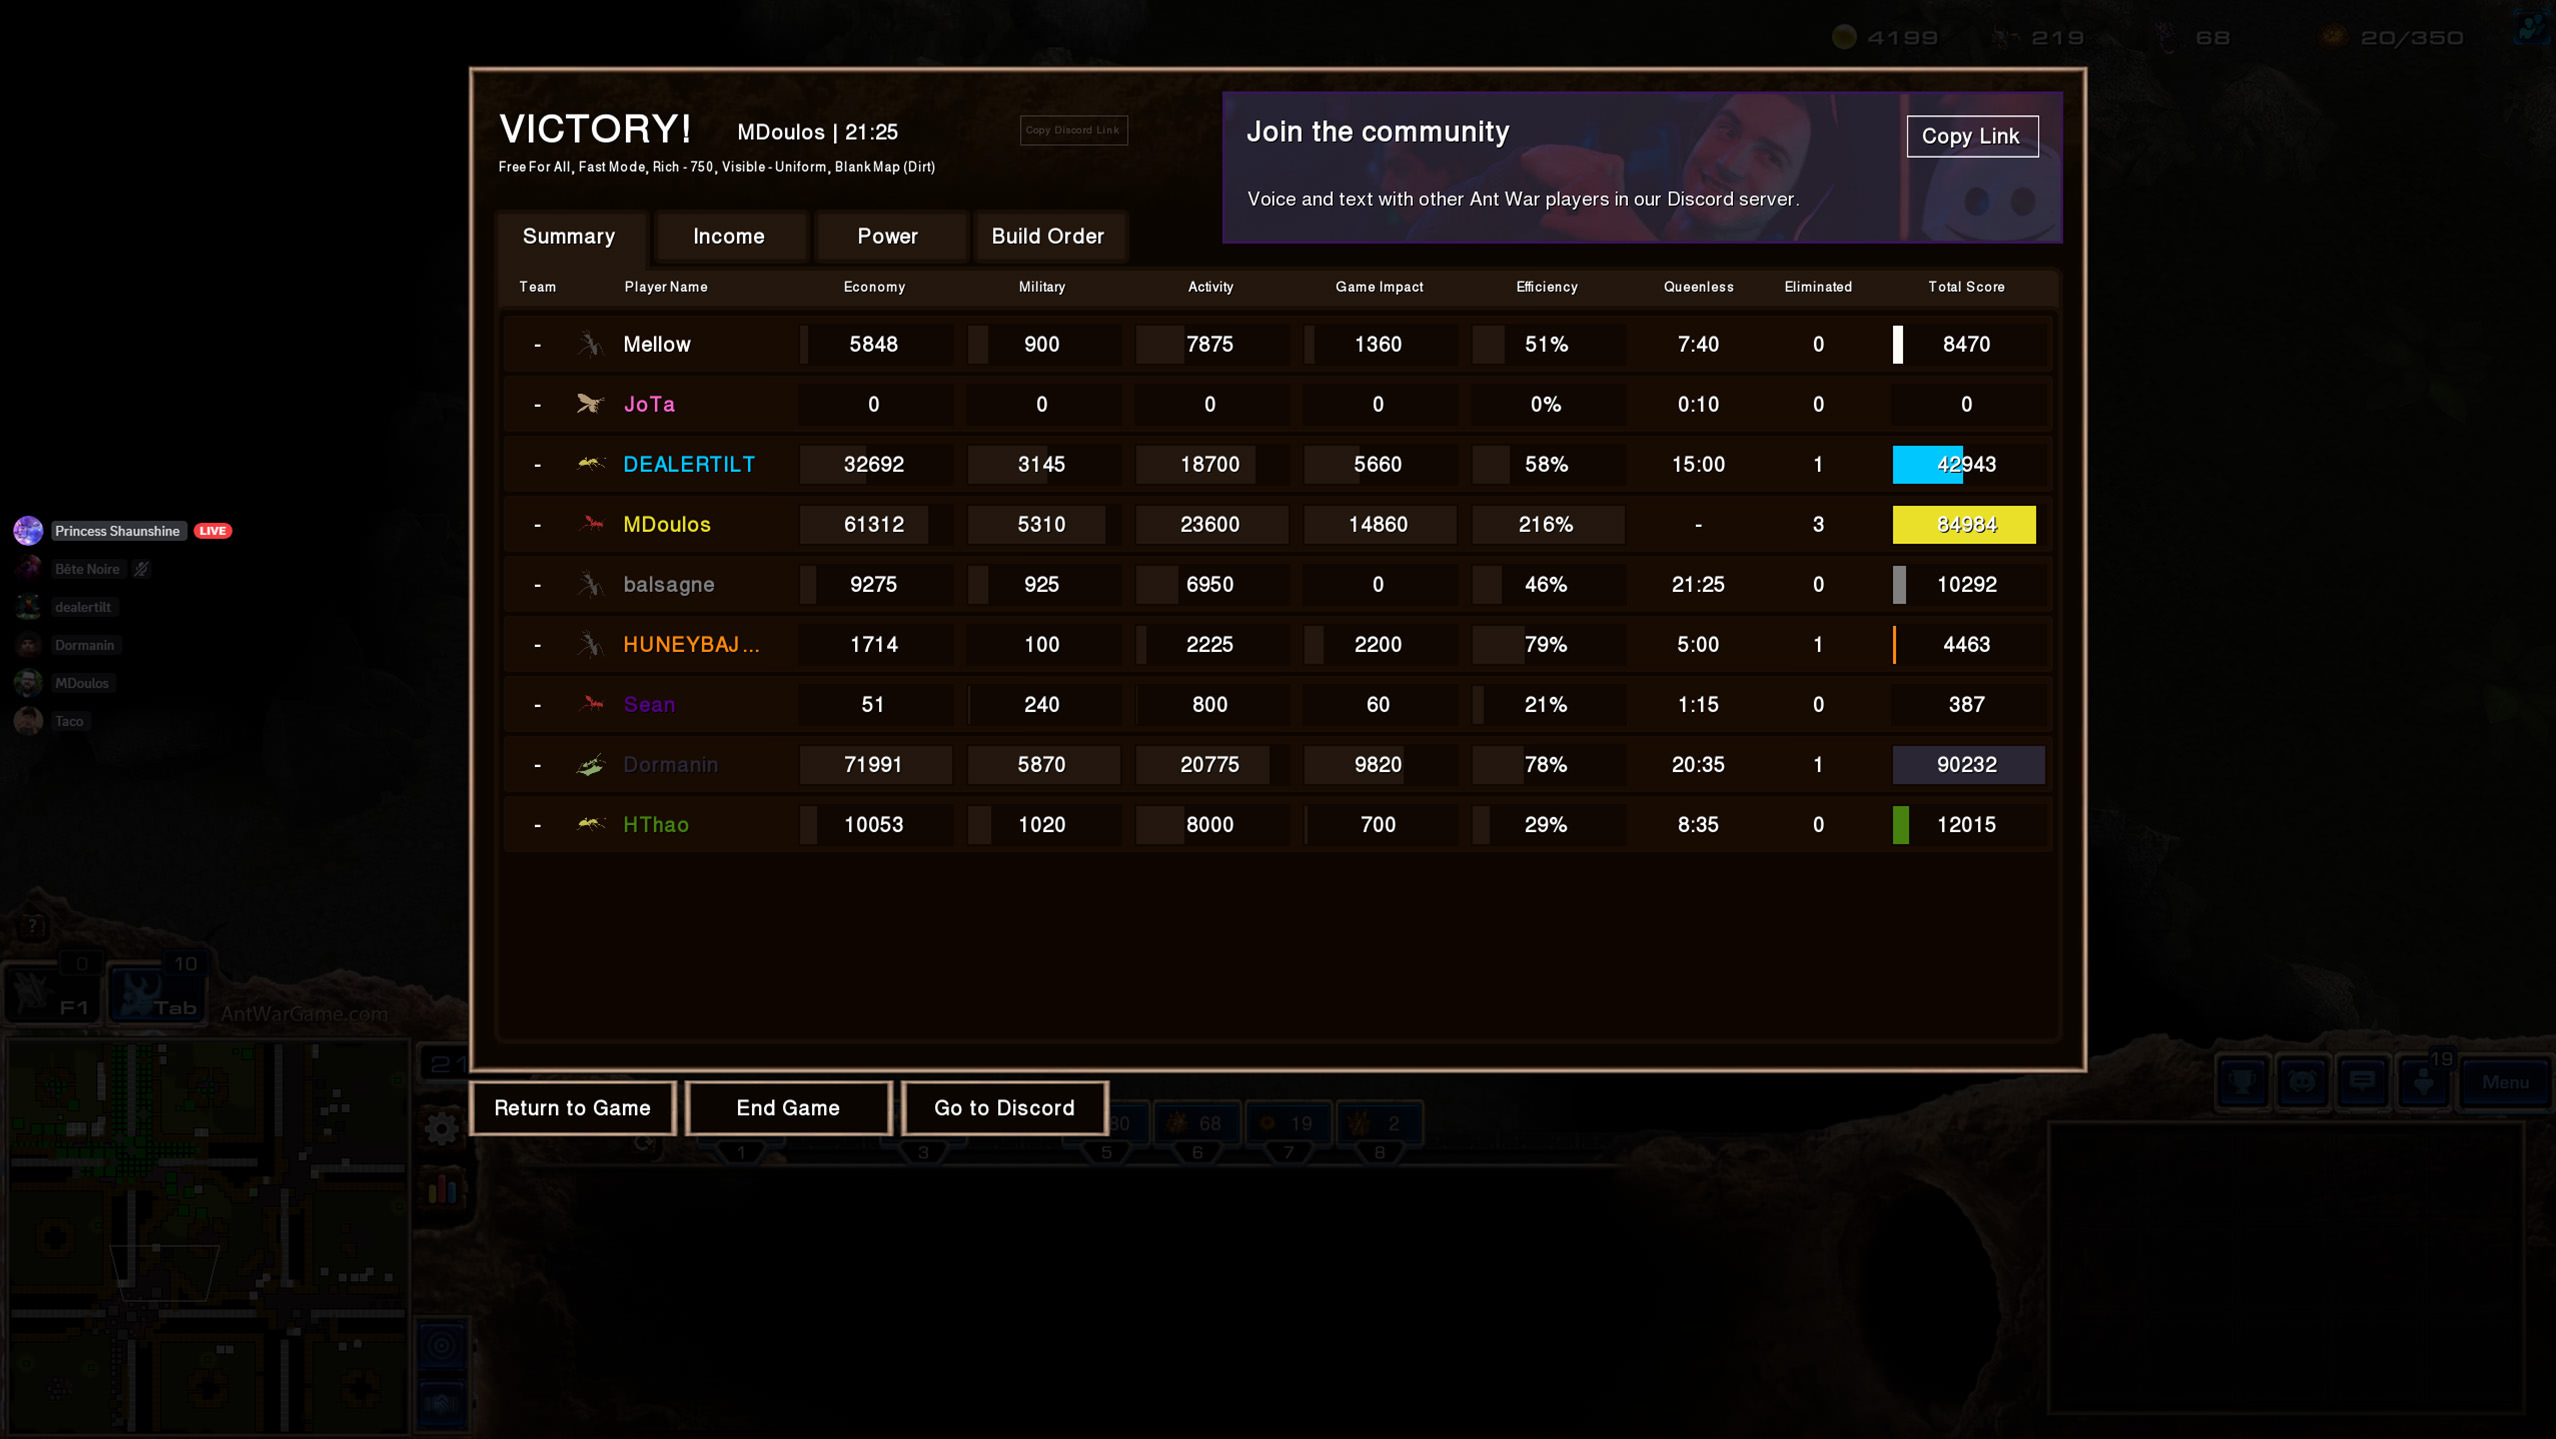
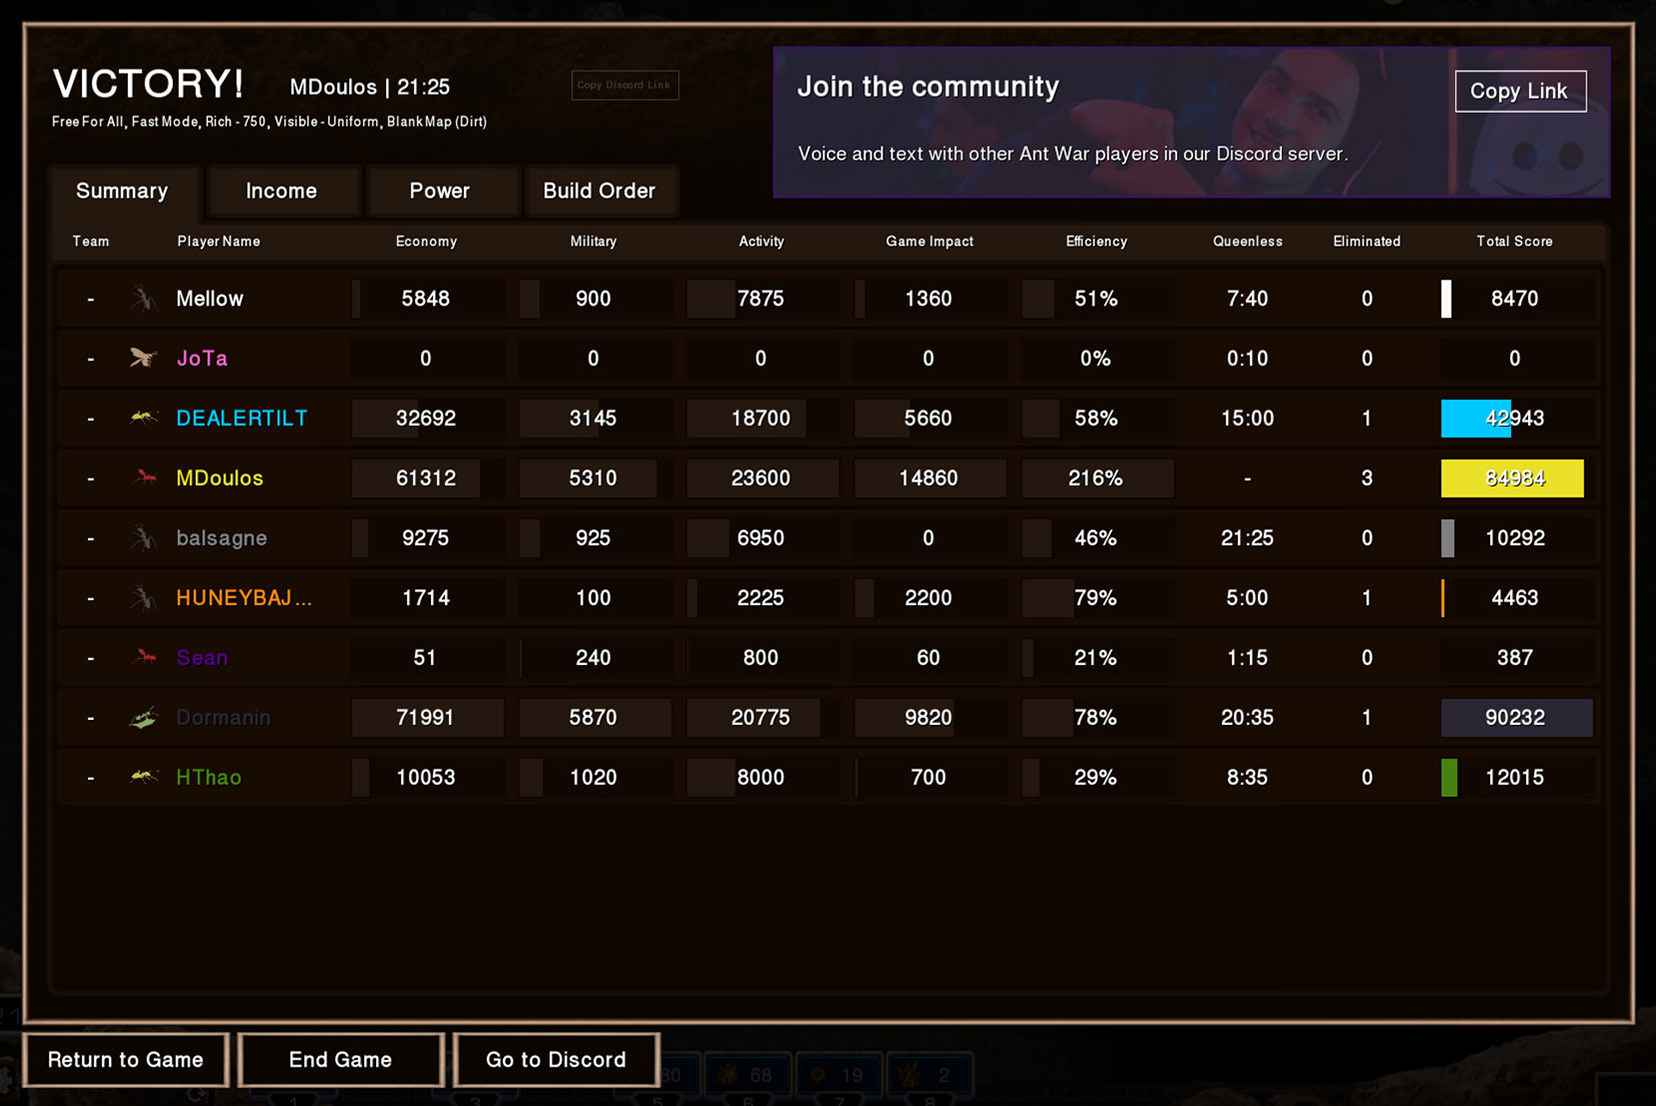
The summary tab is the first tab players see as the score screen flashes onto the screen at the end of the game.
Economy – The economy column records a score for all income in the game. Players can click the Income tab to see a breakdown.
Military – The military column records a score for how much muscle a player wielded in the game. Players can click the Power tab to see a breakdown.
Activity – The activity column records a score for how much a player did or accomplished in the game. It’s a combination of APM, unique actions, and accomplishments.
Game Impact – The game impact column records a score for how much a player actually changed the game. Unit kills, structures razed, and especially player eliminations have a big impact.
Efficiency – The efficiency column records a score that appears confusing at first. Basically it records how much a player was able to eliminate from their opponents, compared to what they had. For example, if a player had 100 Soldiers, and killed 200, their efficiency would be 200%. This sort of measurement records unit and structure trades. In the example above, we can see that I had an efficiency of 216% while eliminating 3 players. This essentially means that in my quest to eliminate the 3 players, I traded my structures and units at a ratio of 2.16 to 1. Essentially, this metric is an attempt to capture the K/D ratio of first person shooters in a RTS. As such, efficiency scores of 500% or more are not uncommon when playing against less skilled players.
Queenless – The queenless column records the time in the game that the player lost their last queen. A higher time here indicates a player lasted longer than their competitors. A blank time indicates a player won the game without losing their queen.
Eliminated – The eliminated column records how many players a player eliminated. A player is eliminated when they lose their last queen. Sometimes a player commits ritualistic suicide in a losing game by typing “-seppuku” in the chat which will instantly kill their queen. These players are considered not eliminated by anyone.
Total Score – The total score column provides a score that combines all of the other columns into one number that is not a simple sum.
Income
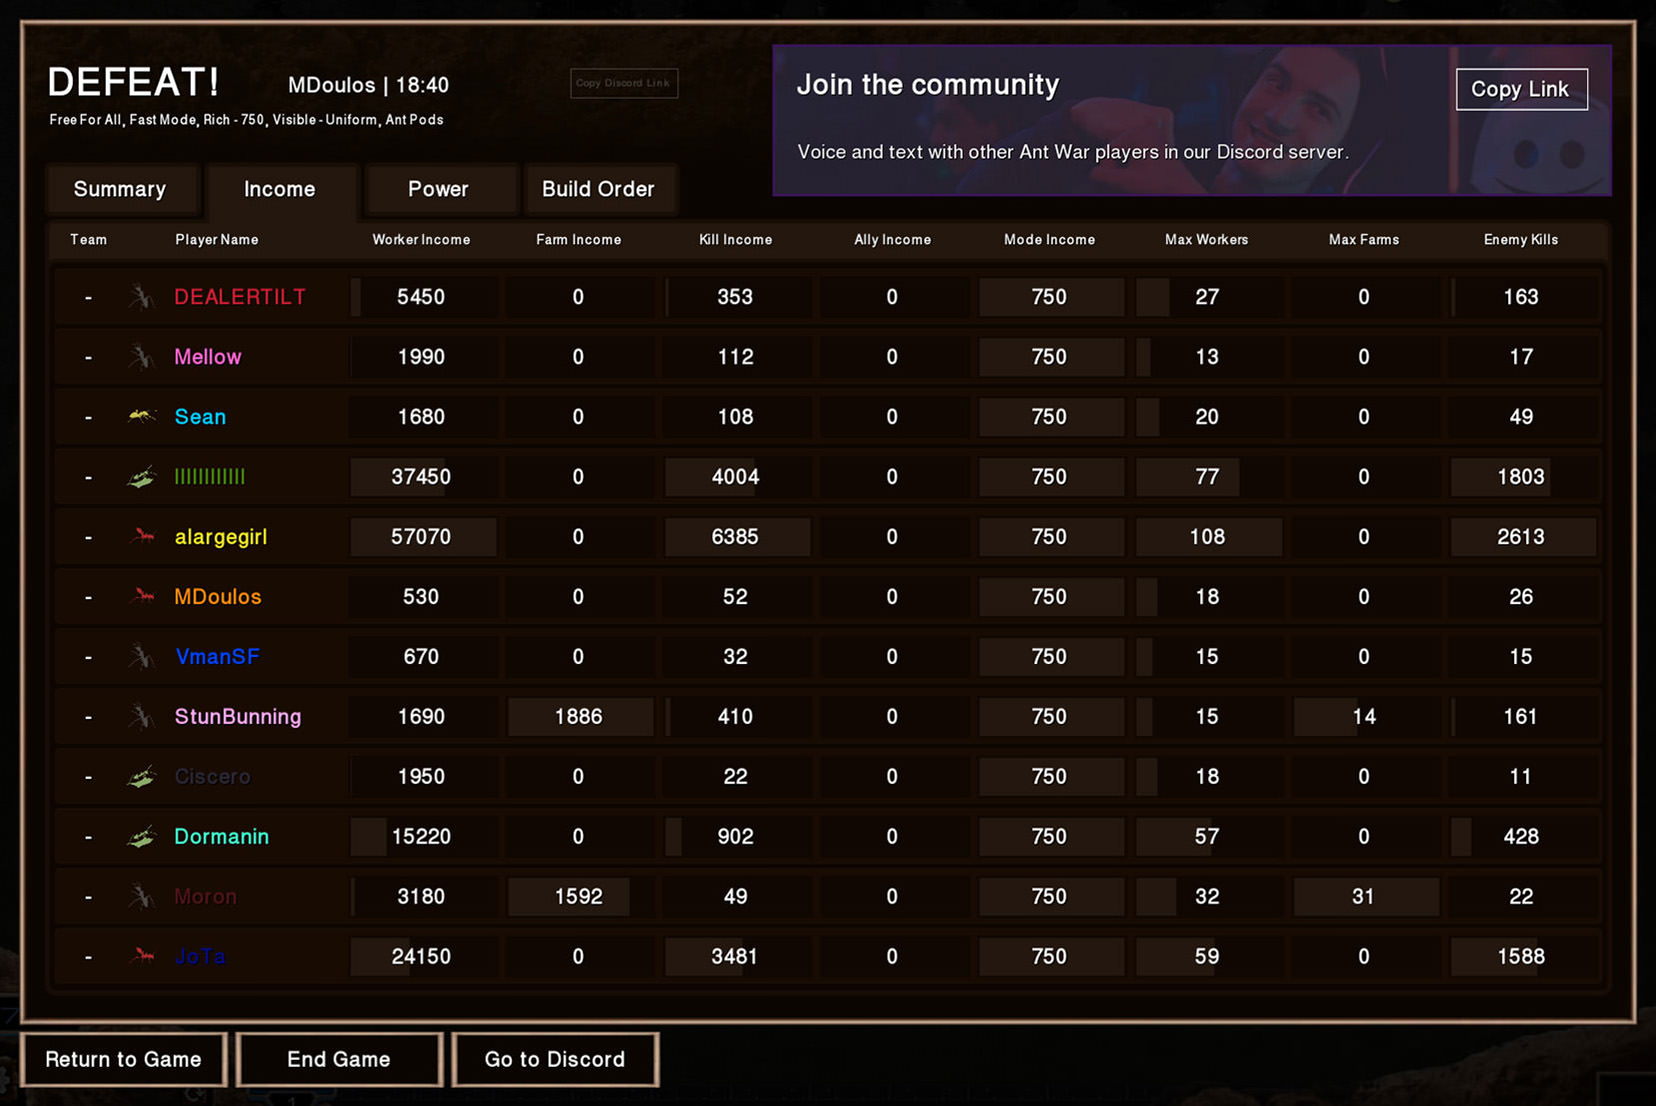
Worker Income – Worker income tracks how much “honeydew” (food, cash) the player’s worker ants collect over the course of the game.
Farm Income – Farm income tracks how much food is passively generated by a players farms which each produce a little bit of food every few seconds.
Kill Income – Each time a player kills an enemy unit, they receive a predetermined amount of food based upon how valuable that unit was.
Ally Income – Ally income records how much money a player receives from an allied player. In team modes, team members may freely send each other resources.
Mode Income – Mode income tracks how much a player receives courtesy of the game mode. In this example, each player started the game with 750 Honeydew. In other game modes, player may receive a passive income and this number would be much higher.
Max Workers – Max workers counts how many workers a player had at their peak worker count. The more workers, the higher the worker income will be.
Max Farms – Max farms counts how many farms a player had at their peak farm count. The more farms, the higher the farm income will be. Generally a higher farm income equates to a lower worker income.
Enemy Kills – Enemy kills records how many total enemy units the player killed. Each unit provides kill income of varying amounts.
Power
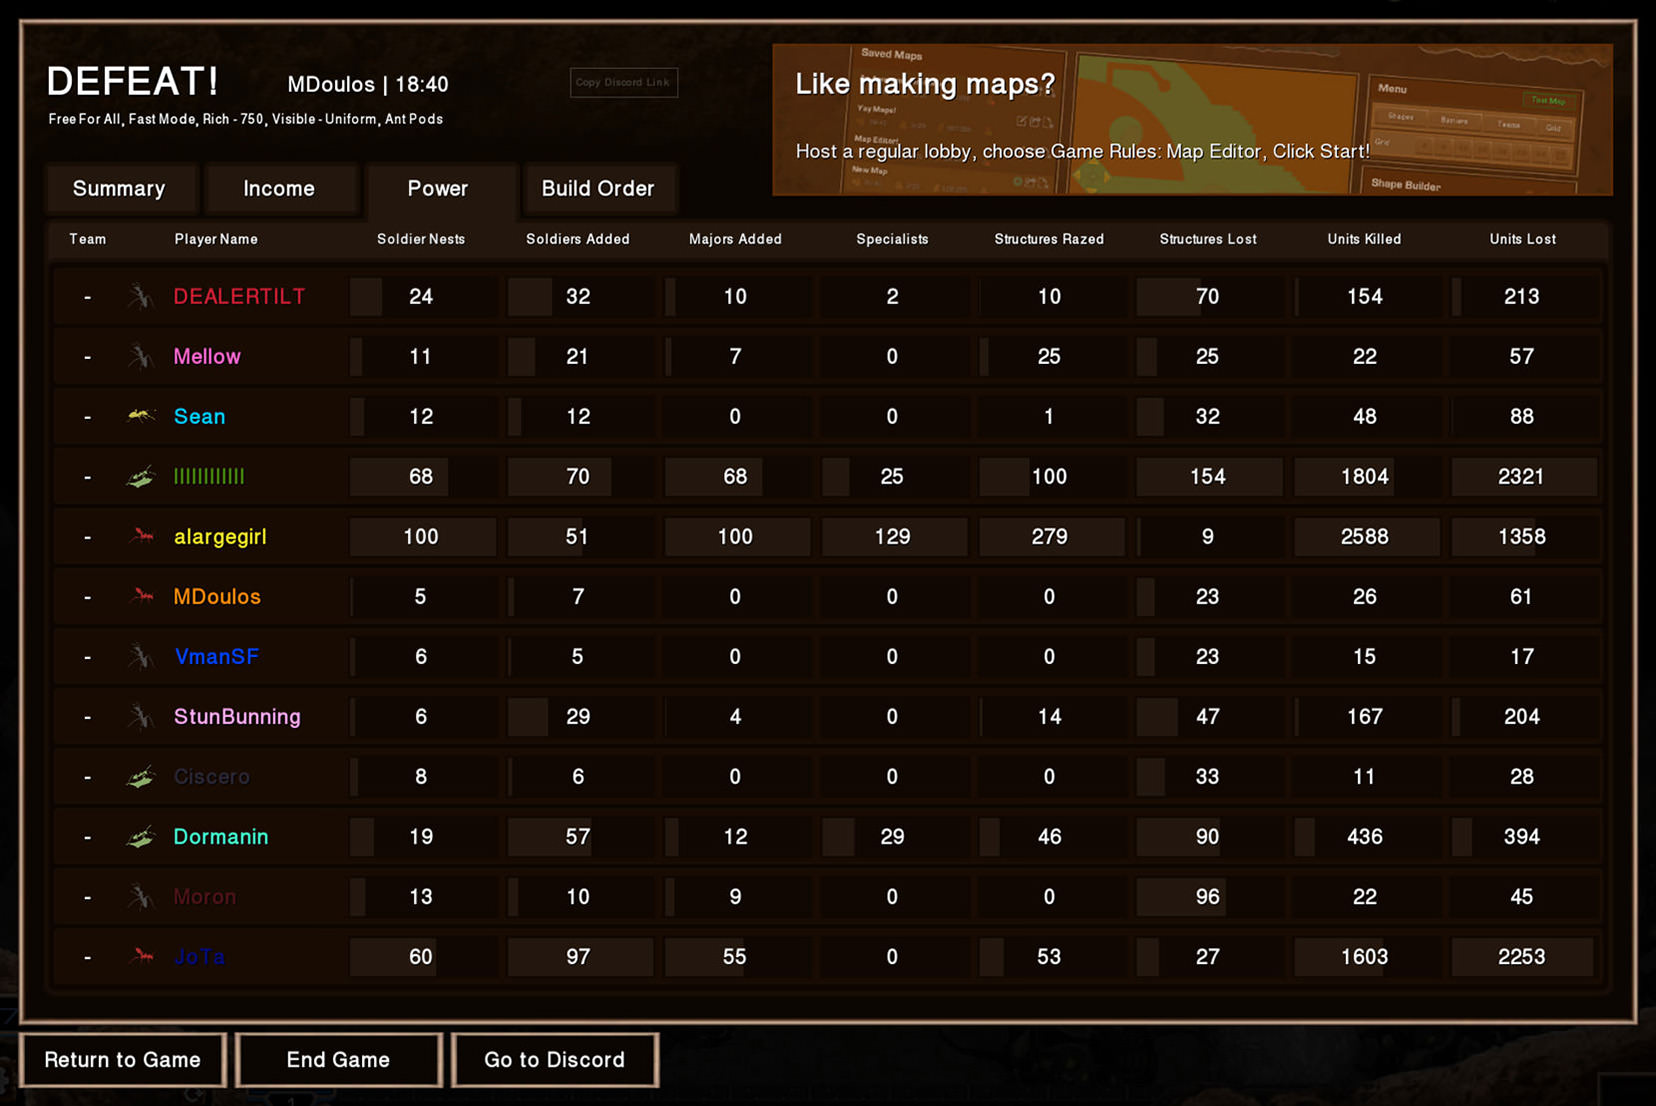
Soldier Nests – Soldier nests records how many soldier nests a player made through the course of the game. 100 is the max.
Soldiers Added – Each soldier nest has a button that allows additional soldiers to continually respawn at it, for an escalating cost. If the nest is lost, all soldiers associated with it will stop respawning.
Majors Added – Each soldier nest allows 1 ant major to start respawning from it. Majors are stronger than regular soldiers and are available to all of the ant races except for Crazy Ant.
Specialists – The specialist column records how many individual specialist units were made, such as: Super Majors, Acid Bombers, Trenchers, etc.
Structures Razed – Structures razed counts how many enemy structures a player destroyed.
Structures Lost – Structures lost counts how many of a player’s structures have been destroyed.
Units Killed – Units killed records how many enemy units a player has eliminated.
Units Lost – Units lost records how many of a player’s units have been eliminated.
Build Order
The build order shows exactly what a player made in the order they made it. Ant War players would instantly recognize the different icons and their associated structures and unit upgrades.
In the example above, all players started the game by building a varying amount of Worker Nests followed by Soldier Nests to defend their workers. Unit icons with plus signs indicated Additional Soldiers added to a soldier nest or the addition of a Major. Up arrows indicate an upgrade was researched.
The arrows in the top right cycle through the various build order pages until the end of the build order is reached.
Studying build order is useful if a player wants to improve. In this game, various things could be learned from the player with a username “alargegirl” (who is not actually large, or a girl in real life. lol) who swept the field. Alargegirl started by building 12 Worker Nests, then 3 Soldier Nests, then kept building worker nests and upgrading his soldier nests with additional soldiers for most of the build orders first page.
Conclusion
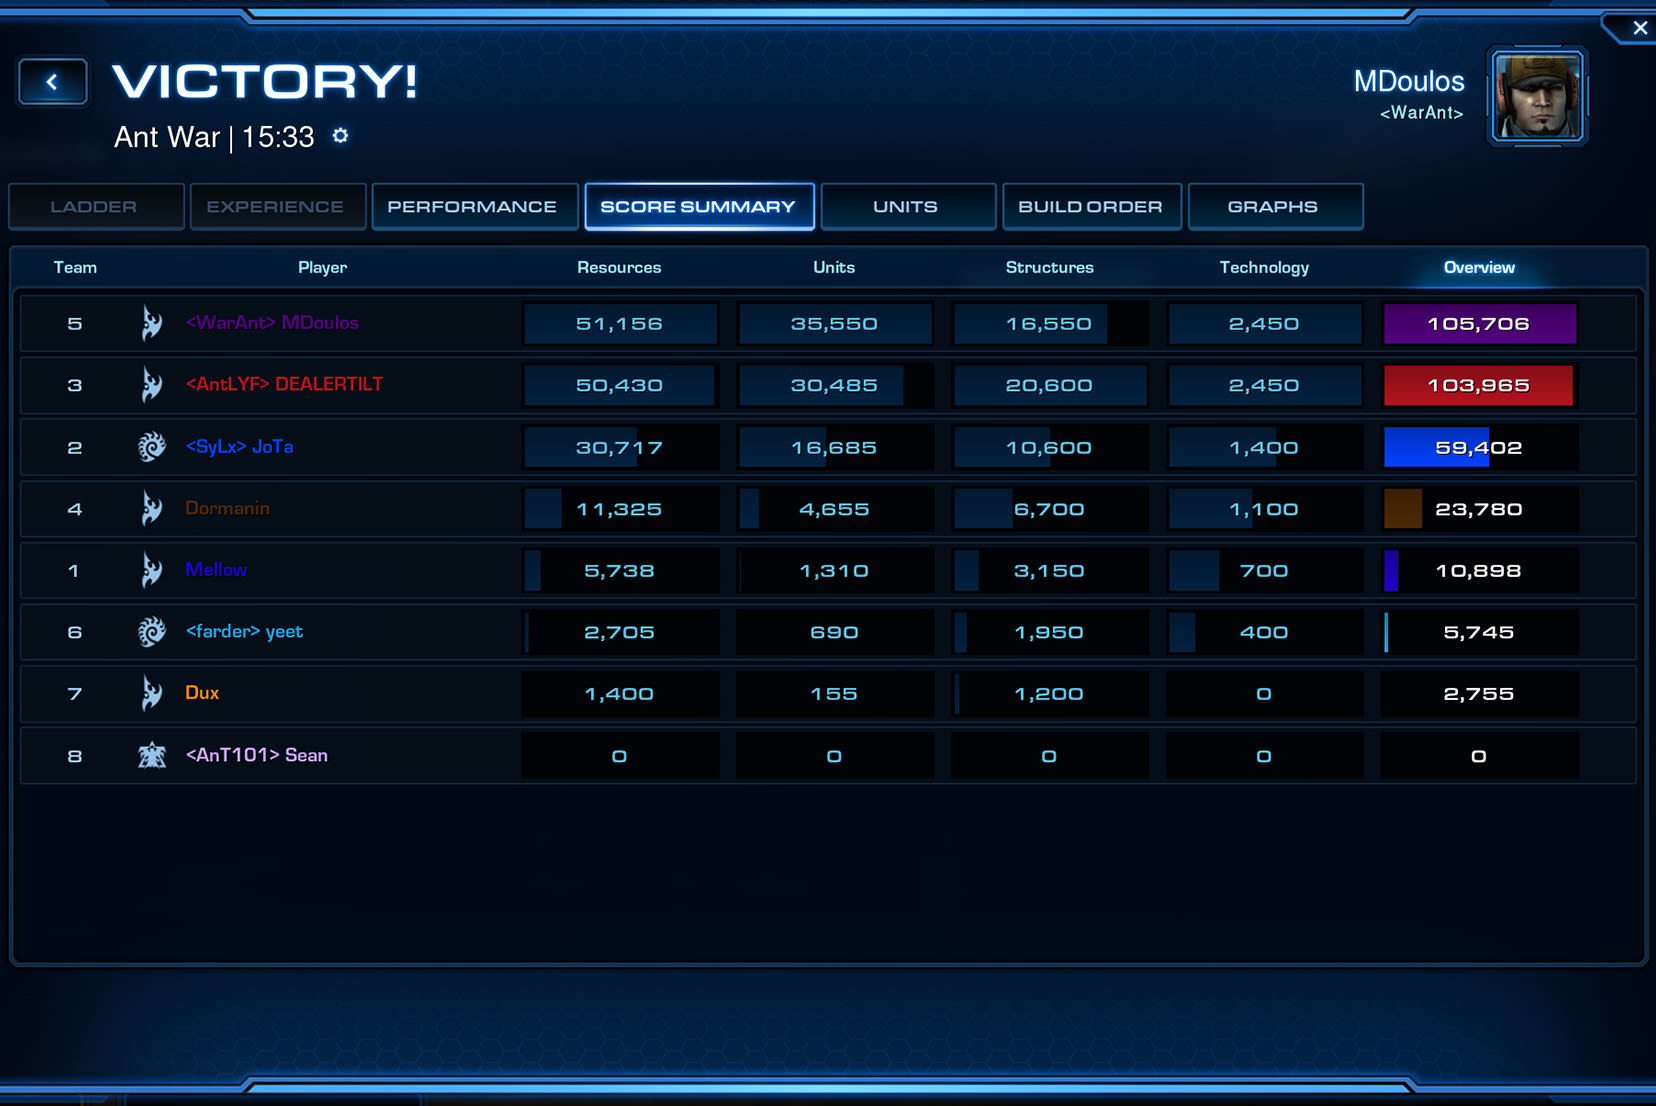
Since Ant War was built using Starcraft 2’s arcade tools, there is a default score screen after the game. But it’s not modifiable and it’s designed to score standard Starcraft 2 gameplay, not custom games.
The influence of the default Battlenet Starcraft 2 score screen on my Ant War score screen design is obvious. I took a similar layout and applied the Ant War aesthetic and added all of the specific metrics relevant to Ant War.
Players are able to see both score screens. First they see the score screen I made at the end of the game after the last enemy queen is eliminated. Second they see the Starcraft 2 score screen with much less relevant detail after the game is ended and they’re back in the Battle Net lobby menus.
You may have noticed the ads for the discord server and the map editor in the top right. Check out the write up I did on the map editor here.


